Study / All readers
In 2025 the index recovered. The surface beneath it had not. Eleven years say the same.
On 13 February and 26 August 2025 VIX and COR1M read almost the same, yet beneath the index fragility had moved from Low to High and 29 of 44 names showed lower co-movement. Over 2,766 sessions the two layers separate easing stress from fuller recovery: the road into an event ran along the high-fragility deck and relief took two routes. A closing section asks what this leaves for a book hedged with the index.
Reading guide
Read the two dates first, then the months between. Then the eleven-year map, as exit shares rather than daily hazards. Then what an index hedge leaves behind for an equity book.
Two readings of one calm
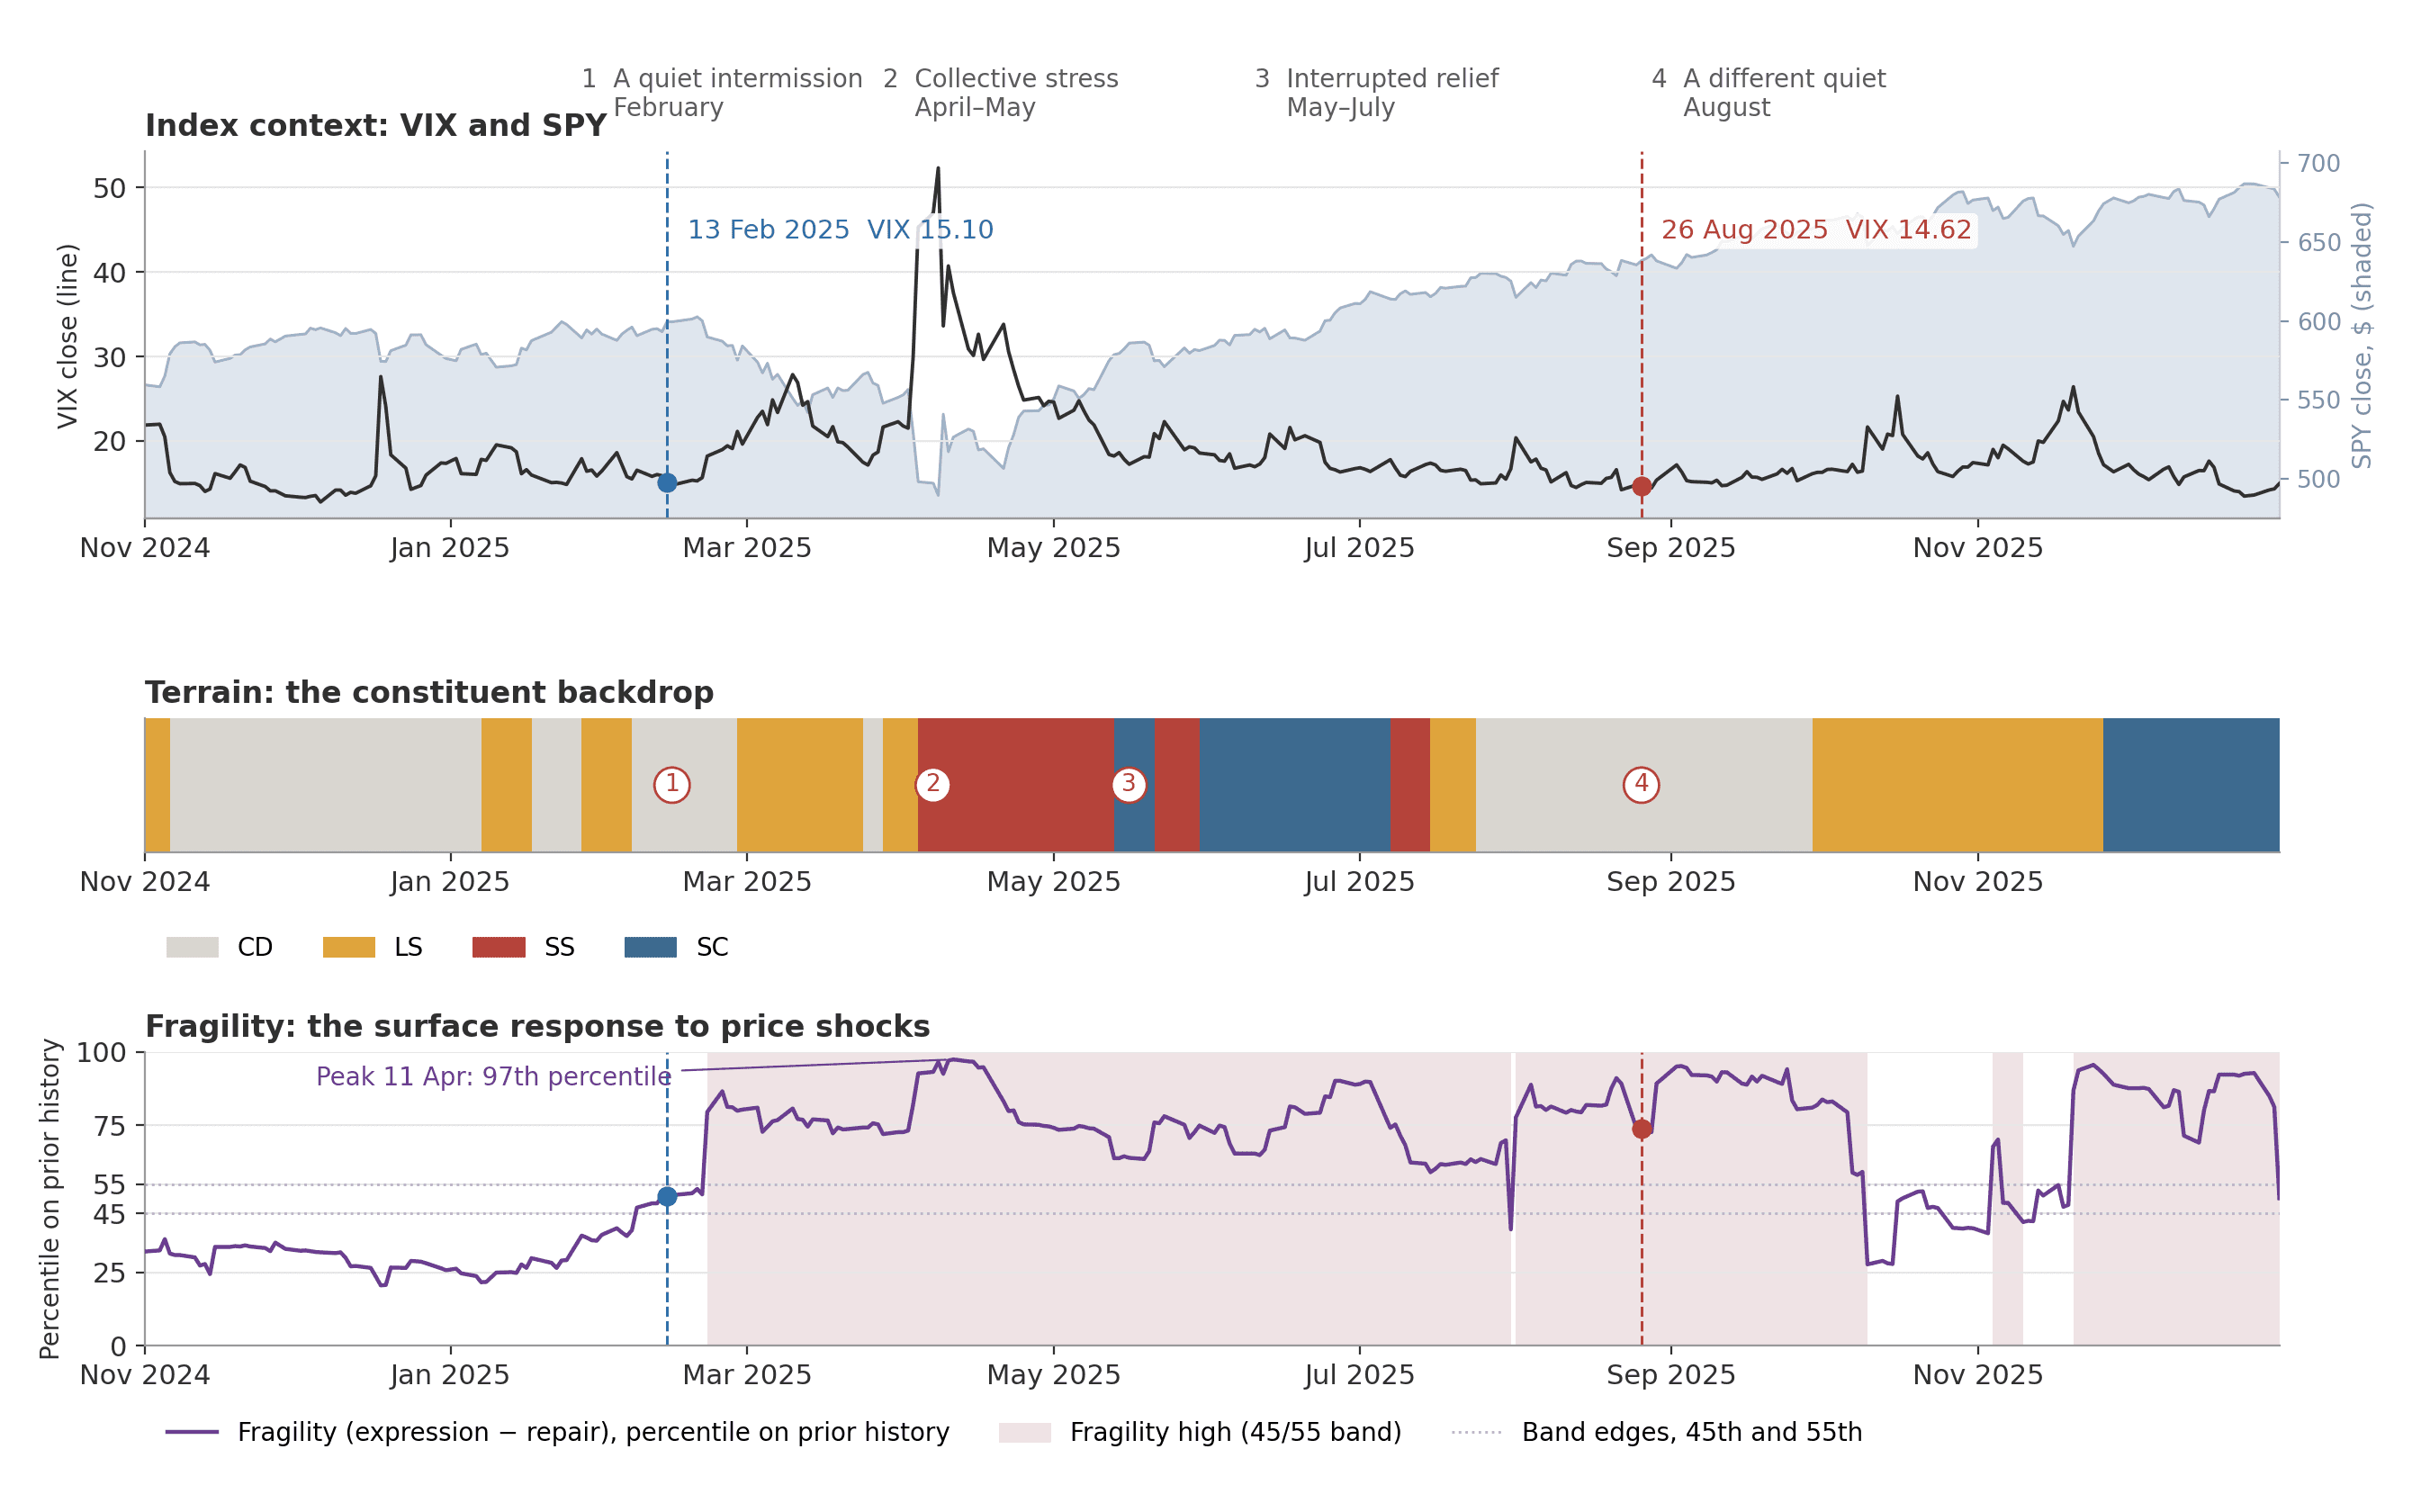
On 13 February 2025 VIX closed at 15.10 and COR1M at 8.36. On 26 August VIX closed at 14.62 and COR1M at 9.30. Between the two dates lay the tariff shock, a VIX print above 50 and a full round trip in the index. By VIX and COR1M the market had returned to where it was. [1]
Beneath the index it had not. In February the terrain read calm with fragility Low, although constituent names showed higher implied-volatility co-movement. In August it read calm again but with fragility High, and 29 of the 44 names present on both dates showed lower co-movement. The two readings are defined in Terrain and fragility: two readings beneath the index.
The mechanics we have in mind
They are ordinary. Leverage, concentrated holdings and hedging obligations change during quiet periods. Demand for protection moves option prices away from a frictionless benchmark, and forced deleveraging can propagate through margin. Positioning, leverage and actual dealer gamma cannot be measured directly; their pressures are observed only through what the option surface and its co-movement express. Shared news also makes names reprice together, so a reading of expression is never an inventory of positions. [2] [3]
A portfolio experiences one path. Funding, hedge transactions and forced deleveraging can change its participation in a recovery even when the index returns to a familiar level, which is why we describe conditions as they unfold rather than averages across histories. [4]
February to April: the two readings turned at different times
The two readings did not move together, and fragility moved first. On 13 February the terrain read CD and fragility 0.29, at the 51st percentile of its prior history and in the Low band. Fragility crossed into the High band on 21 February while the terrain still read CD, and the terrain moved into LS on 27 February.
The two layers intensified together in spring: SS ran from 4 April to 12 May and fragility peaked at the 97th percentile on 11 April, as downside expression increasingly outweighed rally repair.
By August the index had recovered; fragility still read High
On 13 May stress eased into SC while co-movement stayed elevated; fragility receded from its April peak but stayed above February. After brief periods of stress flaring back while the surface still moved together, the terrain returned to CD from 24 July. A month later, by 26 August, the index read as calm as February and the terrain agreed; fragility did not. It read at the 74th percentile and in the High band, and stayed High for most of the rest of the year, with some breaks. [5]
The loosening was broad, but not in the largest names
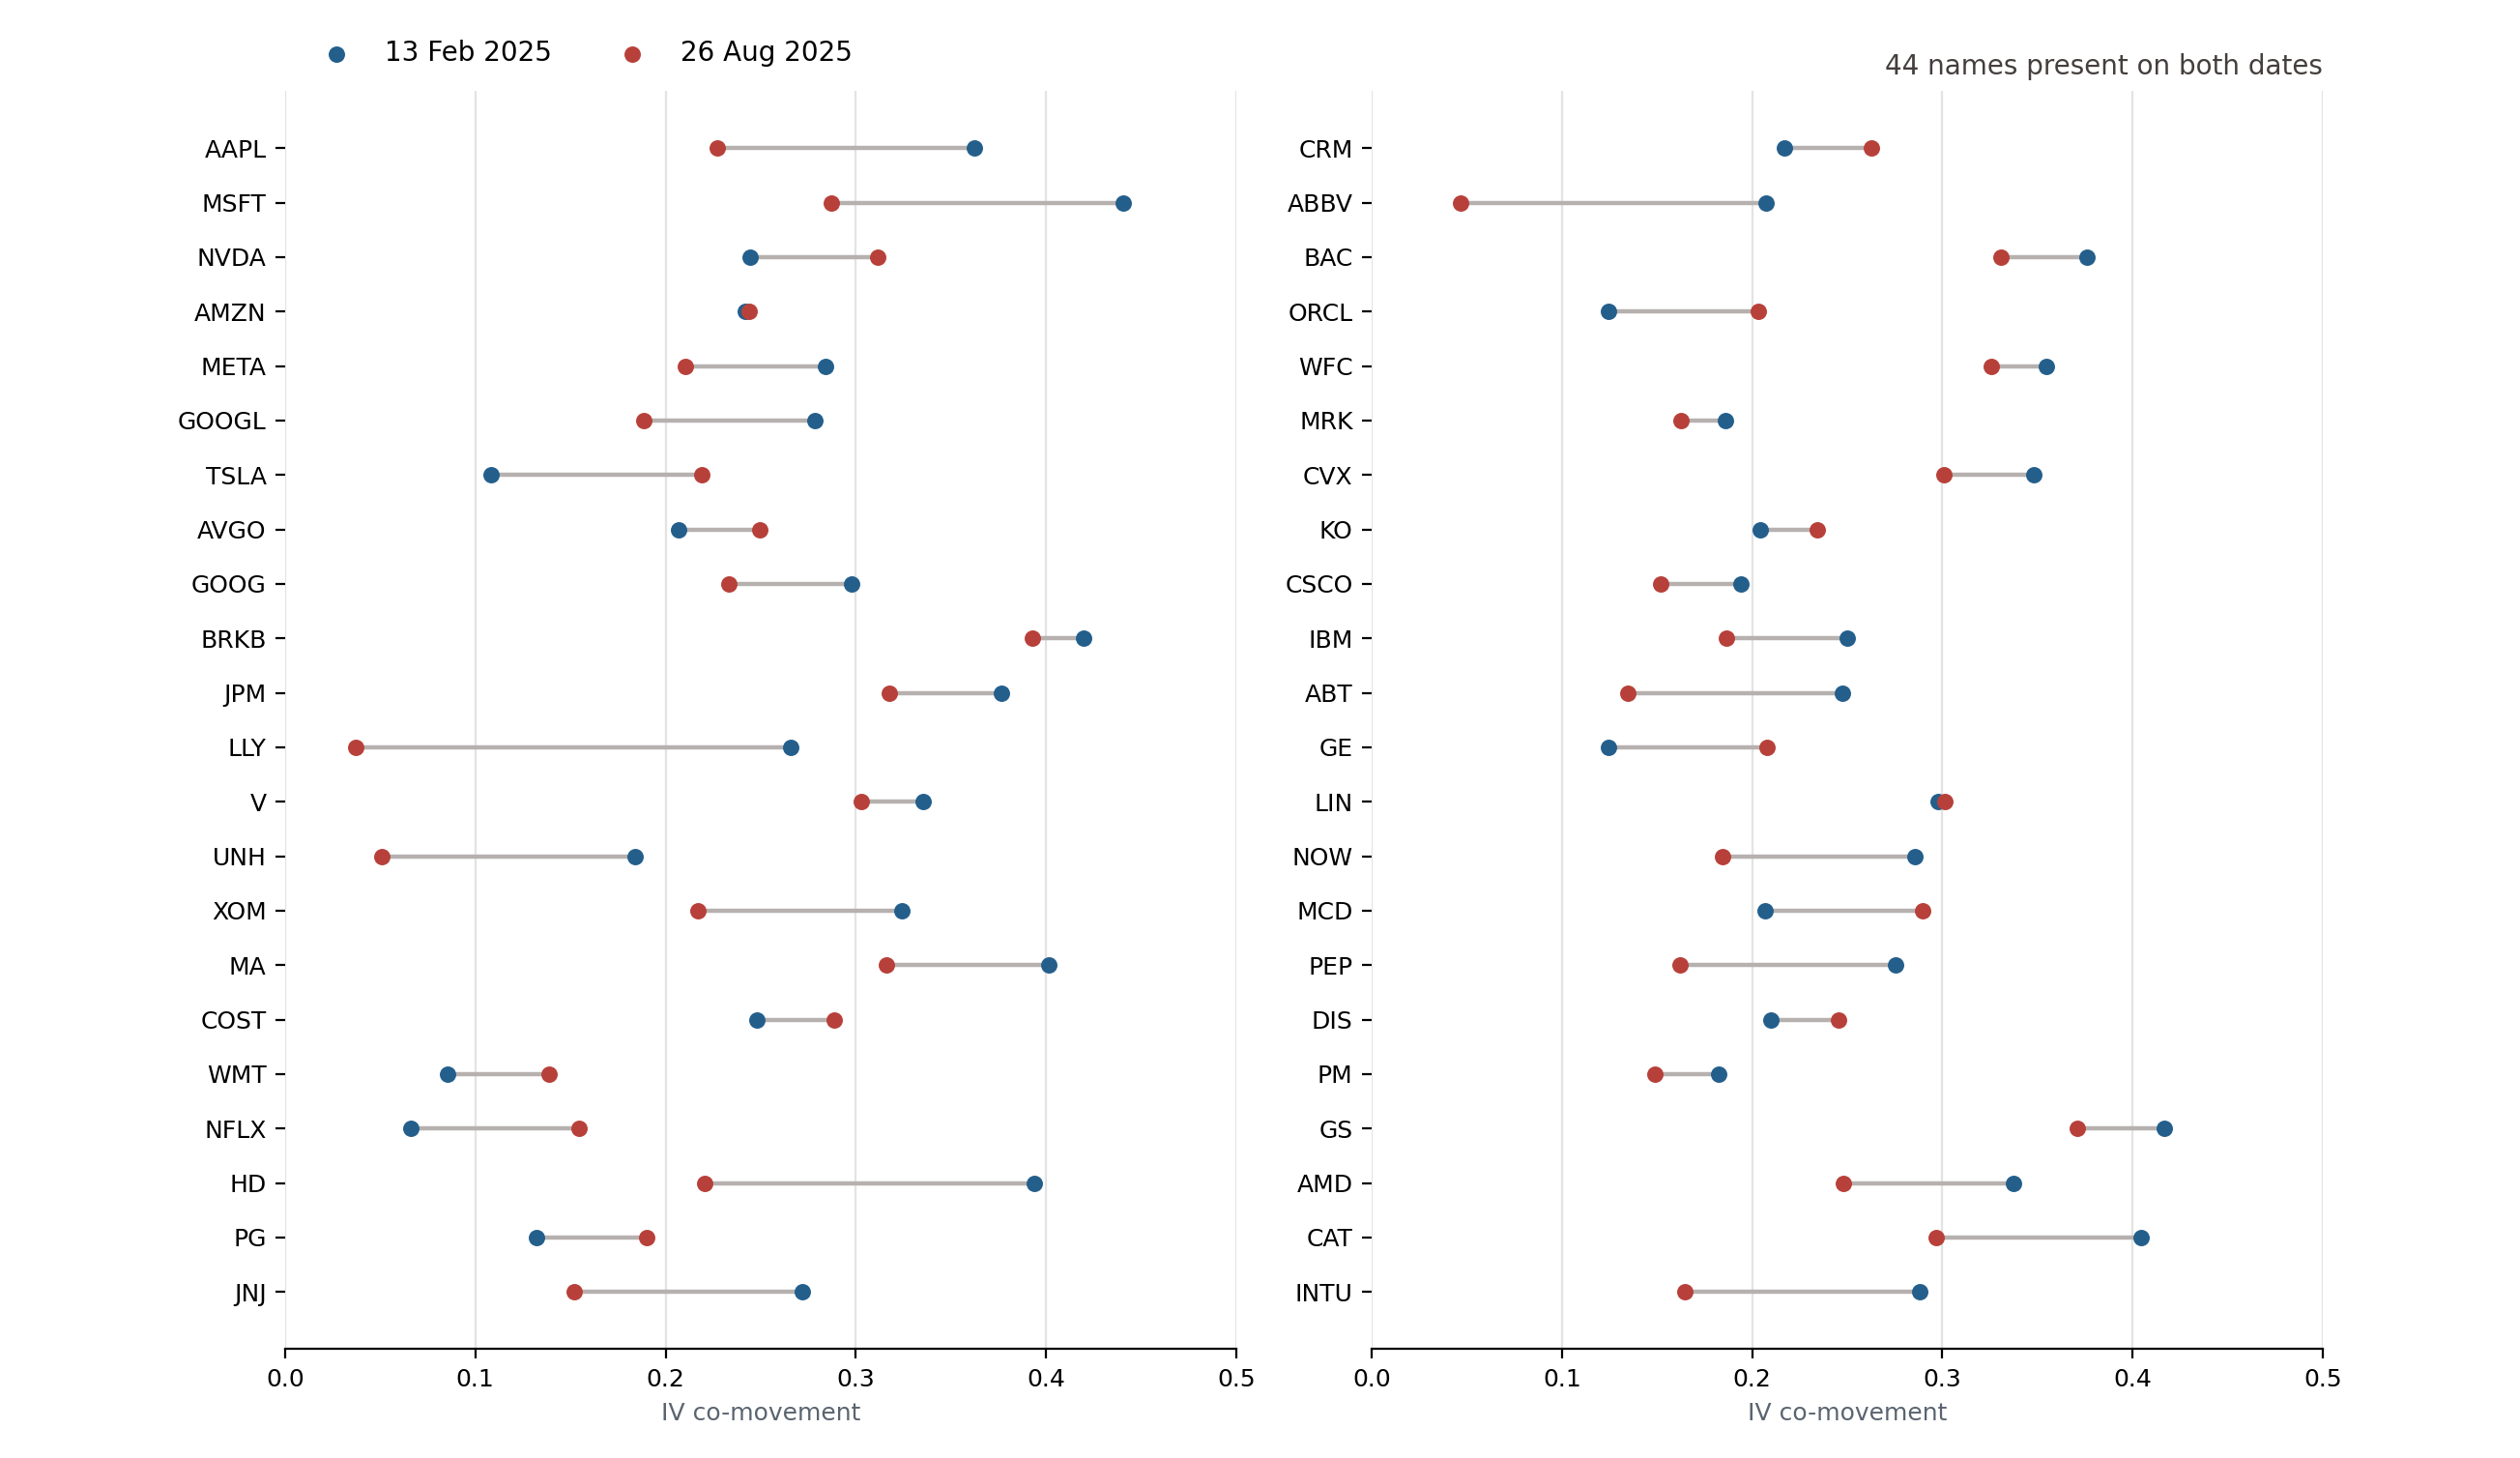
Looking inside the basket checks whether the loosening was broad or confined to a few names. Of the 44 names present on both dates, 29 had lower co-movement in August: 23 of the 34 smaller names, but only 6 of the 10 largest, where NVDA, TSLA and AVGO moved closer to the basket and AMZN was unchanged. The loosening was broad but not uniform, and two names sat within 0.02 of their February reading. [5]
COR1M rose while the names' co-movement fell: a price against a record
Between February and August COR1M rose from 8.36 to 9.30 while the co-movement reading fell from 0.26 to 0.22, for the basket and for 29 of the 44 common names. They answer different questions. COR1M is a price: the correlation the option market charges for the next month. The co-movement reading is a record: how the names' implied volatilities actually moved together over the last 60 sessions. Over 2015–2025 the two are moderately related, with a rank correlation of 0.56, so August is a divergence worth noting, not a contradiction. [1] [5] Whether August's price ran ahead of behaviour, this episode cannot say.
What this does, and does not, say for a desk
These layers support a review of which positions joined common repricing and which surfaces kept a stronger downside response. They belong beside return correlations, factors and earnings. The episode does not say which of the two August readings was right, and it does not say what happened next because of the difference. It is one episode; whether the same distinctions recur across eleven years of them is counted below.
The data behind the episode
Terrain and fragility are read at each session's close, from the option surfaces of the point-in-time fifty largest US names, and ranked against their own prior history as described in Terrain and fragility: two readings beneath the index. The co-movement reading is the 60-session correlation of daily implied-volatility changes across name pairs; each name is measured against its own date's basket, whose other members can differ, which is why the comparison between February and August is made on the 44 names present on both dates. VIX and COR1M are Cboe's published closes on the same dates. [1] [5]
One episode, read after the fact on one dataset: the readings describe what the surfaces did between two dates, not why, and they carry no null test.
Eleven years of eight cells
Eight cells over 2,766 sessions
Each of the four terrain cells, CD, LS, SS and SC, splits by the fragility band, High or Low, into eight cells; the readings are defined in Terrain and fragility: two readings beneath the index. We classify every session from January 2015 to December 2025, 2,766 of them, and draw the routes taken five or more times: 128 of the 160 exits. Each cell is defined by three readings, stress, synchronisation and the fragility band, and each crosses its own threshold separately, so an exit almost always changes one reading and lands in one of three adjacent cells: 153 of the 160 did. The map therefore records which adjacent cell a cell led to, not a choice among all eight.
Circles carry each cell's share of the 2,766 sessions; arrow labels give the route's count out of all exits from its origin cell. Same-cell sessions are excluded, so these are exit shares, not daily hazards. First and last visits are boundary-censored. [5]
| From → to | CD Low | CD High | LS Low | LS High | SS Low | SS High | SC Low | SC High | Exits |
|---|---|---|---|---|---|---|---|---|---|
| CD Low | – | 7 | 10 | 0 | 2 | 0 | 0 | 0 | 19 |
| CD High | 4 | – | 0 | 14 | 1 | 0 | 1 | 4 | 24 |
| LS Low | 11 | 0 | – | 4 | 2 | 0 | 0 | 0 | 17 |
| LS High | 0 | 12 | 2 | – | 0 | 5 | 0 | 1 | 20 |
| SS Low | 0 | 0 | 5 | 0 | – | 6 | 15 | 0 | 26 |
| SS High | 0 | 0 | 0 | 2 | 11 | – | 0 | 9 | 22 |
| SC Low | 4 | 0 | 0 | 0 | 9 | 2 | – | 2 | 17 |
| SC High | 0 | 5 | 0 | 0 | 0 | 9 | 1 | – | 15 |
| Entries | 19 | 24 | 17 | 20 | 25 | 22 | 17 | 16 | 160 |
Table 1. Every exit between the eight cells, 2 January 2015 to 31 December 2025: 2,766 sessions, 160 exits. Rows are the cell left, columns the cell entered; High and Low are the fragility band. The diagram draws the fourteen routes with five or more exits. Seven exits change two readings at once. [5]
Stress builds on the high-fragility deck; relief takes two routes
The road into an event runs along the upper deck, where fragility is High: CD moved to LS in 14 of its 24 exits, and LS returned to CD 12 times for every 5 it entered SS. Relief took two forms, as in the episode above. High-fragility SS ended either by dropping to the lower deck, a fragility release, in 11 of its 22 exits, or by easing into SC in 9, and that SC returned to SS in 9 of its 15 exits. The remaining exits are rare diagonals, each seen fewer than five times.
The lower deck is quieter: LS mostly returned to CD, 11 of 17, and SS mostly eased into SC, 15 of 26. SC is one step from SS by construction, so the flip back is common rather than surprising. Small counts and dependent spells rule out reading the arrows as forecasts.
Under stress, high fragility came with worse realised-volatility tails, on few episodes
Did the cells describe different volatility experiences? We compare starting implied volatility with realised volatility over the following 21 sessions, for High and Low fragility within each terrain cell; the figure below shows the result. [5]
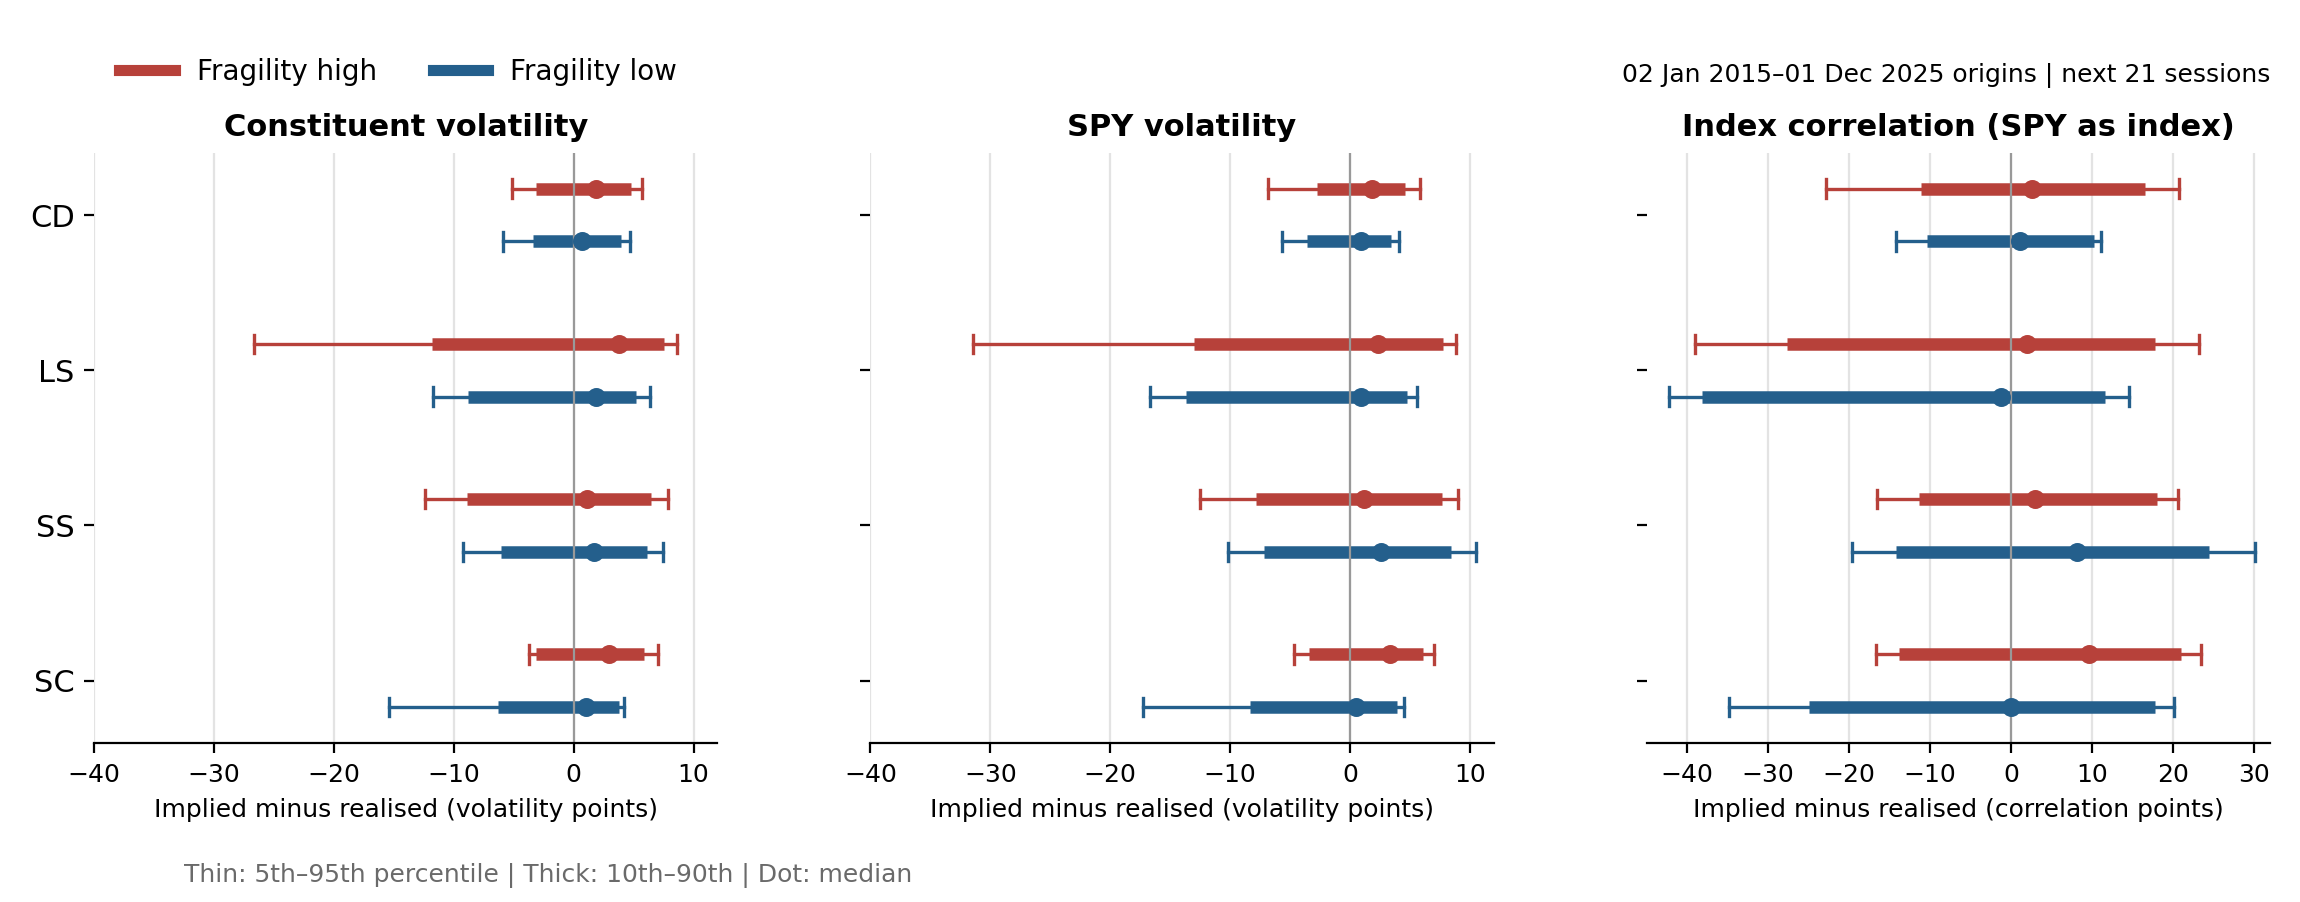
The contrast is concentrated in adverse outcomes. During elevated stress the high-fragility cells had the worse lower tail: the constituent gap's fifth percentile sat near −27 volatility points in LS with fragility High against −12 with it Low, and SS pointed the same way, −12 against −9. The calm cells did not separate this way. In SC the Low-fragility tail is the deeper one, −15 against −4, and all of it comes from nine sessions of August 2015; without 2015 the two are within a point. Medians show no consistent ordering.
Sessions per cell, fragility High then Low: CD 622 and 317; LS 314 and 169; SS 431 and 544; SC 175 and 173. The strongest contrasts come from COVID, spring 2025 and August 2015, and overlapping forward windows give far fewer independent observations than those counts suggest. This is a descriptive sample with no null test. [5] [1]
Implied against realised correlation
The right panel makes the same comparison for correlation. Implied correlation is built as COR1M is, from the same fifty names' 30-day implied volatilities, their index weights and SPY's own 30-day implied volatility; realised correlation applies the same formula to the next 21 sessions' realised volatilities, with SPY as the index on both sides.
Implied exceeded realised by a median 3.1 points, consistent with priced correlation risk [6], and by more in the synchronised cells, SS 5.4 and SC 4.9, than in CD, 2.3, and LS, 1.1. Within SS and SC the fragility bands order oppositely, so this panel separates terrain, not fragility.
The level rests on a choice the formula leaves open. Taking the fifty-name basket's realised volatility as the index instead of SPY's raises the realised side by a median 5.7 points, because SPY holds some 450 more names that diversify it, and turns the overall median negative, −2.5 points, while the synchronised cells stay above CD and LS. The same gap is why this comparison cannot settle the February–August divergence above: it is larger than the change to be explained.
What the map does, and does not, say
The forward comparison holds each origin date's membership and weights fixed over the following 21 trading sessions and uses the same eligible names in both constituent volatility legs; its last origin is 1 December 2025. COR1M, where it is compared, uses its own basket and weights. Sessions per cell are counted above; the effective number of independent observations is far smaller, because consecutive origins share most of their forward window. [5]
Together, the paths and the outcomes single out one combination of readings worth a desk's own test on its own book: visible stress coinciding with a more asymmetric surface response, and either of them easing. Whether that combination should change anything a desk does is the desk's question under its own mandate and rule, not this study's; the study records where the cells led and what followed, on eleven years and few episodes.
What an index hedge leaves behind
The two layers above are read from the whole market. A book hedged with the index meets them as a question about what the hedge covers and what it leaves. This closing section sets that question out without data: three quantities that should stay separate, and what the options view can add to an exposure review.
The stock thesis and the market exposure
A position can express a company view while also carrying market, sector and style exposures. An index hedge can offset an estimated market component, but that does not make the remaining position independent of other common influences.
The practical starting point is the investment question: which exposure is the hedge intended to reduce, over what horizon, and under which scenario? A hedge selected for ordinary market variation may behave differently during a concentrated company event or a change in correlations.
Three quantities that should stay separate
Historical return attribution describes a realised path. A risk model estimates how future variation might be distributed across factors and residuals. Option-surface response describes how quoted protection has repriced with observed moves.
Each can inform a different part of the discussion. An option percentile is not a percentage of portfolio risk. Co-movement in implied volatility is not the same as correlation of stock returns. The residual left after a market-only regression can still contain sector, style, event and model effects.
- Market-associated returns: the component implied by the chosen market model.
- Residual returns: what that model does not explain, including omitted shared factors.
- Surface response: how implied volatility or skew changes alongside those moves.
What the options view could contribute
The additional question is whether options reveal a change in downside pricing or response that the existing exposure review does not capture. An analyst might examine whether repricing is concentrated in a few names or shared across the equity universe, then compare it with earnings, sector moves and conventional volatility measures.
That is a research hypothesis to test against the team's current process. A visually different reading is not sufficient. The observation needs to change the interpretation of a concrete risk question without simply restating an existing factor or event.
A useful conversation, before a portfolio prescription
For an equity long/short team, the discussion may concern retaining a stock thesis while understanding its common exposure. For a family office investing directly in equities, it may concern the limitations of broad index protection around a concentrated holding. For a risk committee, it may concern what can be put on paper about market conditions on the day a decision was taken, and, when prices recover, whether the downside repricing beneath the hedge has recovered too, which is the question the episode above put to one year.
Altus's public reading describes the covered US large-cap options universe. It does not analyse a visitor's holdings, prescribe a hedge or establish how much of their portfolio risk is idiosyncratic. A portfolio-specific answer would need its own positions, model, horizon and validation.
Sources
[1] Cboe Global Markets. Daily index histories, 2015–2025: VIX, VIX3M, VVIX, SKEW, VIXEQ, COR1M and DSPX. VIX historical data; COR1M history.
[2] Gârleanu, N., Pedersen, L. H. and Poteshman, A. M. "Demand-Based Option Pricing." Review of Financial Studies 22(10), 4259–4299 (2009). doi:10.1093/rfs/hhp005.
[3] Schrimpf, A., Shin, H. S. and Sushko, V. "Leverage and margin spirals in fixed income markets during the Covid-19 crisis." BIS Bulletin 2, 2 April 2020. bis.org/publ/bisbull02.pdf.
[4] Peters, O. "The ergodicity problem in economics." Nature Physics 15, 1216–1221 (2019). doi:10.1038/s41567-019-0732-0.
[5] Altus Works. Data and methods notes, October 2026, available to reviewers on request: the point-in-time fifty largest constituents of the US large-cap index, 30-day constant-maturity implied volatility built from option quotes, adjusted closes, the terrain and fragility readings as published by the Altus terminal on 9 October 2026, and, for each exhibit, the protocol, code and checks behind it.
[6] Driessen, J., Maenhout, P. J. and Vilkov, G. "The Price of Correlation Risk: Evidence from Equity Options." Journal of Finance 64(3), 1377–1406 (2009). doi:10.1111/j.1540-6261.2009.01467.x.
[7] Vargas, V., Dao, T.-L. and Bouchaud, J.-P. "Skew and implied leverage effect: smile dynamics revisited." arXiv:1311.4078, November 2013. arxiv.org/abs/1311.4078. Background on smile dynamics.
Where the interpretation ends
One episode read after the fact, and a descriptive eleven-year sample with small counts, dependent spells and no null test. COR1M is a price and the co-movement reading a record; they answer different questions. Nothing here says which reading was right, or what happened because of the difference.
Descriptive measurement of past market data. No portfolio holdings are analysed and no investment or trading recommendation is made.
Important information
This item describes measurements of past market data: developed history from one dataset over one window, January 2015 to December 2025, with option marks from one quote snapshot at mid, without fills. It does not establish predictive ability or trading profitability, and nothing here is investment advice, a recommendation to transact, or an offer or solicitation concerning any investment. Option and index data are licensed from third parties and remain subject to their terms. Altus Works develops the measurements and the Terminal described and has a commercial interest in their adoption.