Study / Volatility
More tilt, less level: how protection's response to falls has changed
On ordinary 0.5–2% SPY falls, the constituents' skew now tilts more than it did before 2020 and their volatility level moves less, but the put–call gap a hedge is priced on changed far less than either part. At the strike a book holds, most of the surface move is slide, protection marks mostly on spot, and what fell is the cost of entry.
Reading guide
Start with the contract a book holds rather than a point on a surface. Then three layers in turn: fragility by period, the gap split into a shape part and a level part, and the held strike. Then the money: what the vol part of a held put's mark is worth on the day, against the cost of entering it.
Start with the option you actually hold
A surface chart follows a convention. A portfolio holds a contract. After the underlying moves, a 25-delta put on today's surface may have a different strike from yesterday's 25-delta put. Comparing those two points answers a question about surface shape. It does not directly measure the change in the option already in the book.
A held-contract comparison keeps strike and expiry fixed. It can then separate the option's response to the underlying move, passing time and changes in implied volatility. That distinction is especially important when a surface observation is translated into money units.
Separate common moves from residual moves
A stock can fall alongside the market, or move differently from it. A prior-estimated market beta provides one way to split the stock return into a market-associated component and a residual. This is a statistical description, not proof of what caused the move.
The research question is whether the same option's implied volatility responds similarly to those components. Pooling them into one own-return sensitivity can obscure differences. Equally, a pooled relationship across stocks does not establish a stable estimate for each stock.
An option mark is more than a volatility response
A useful comparison follows the held option through the same dates and reconciles the parts to the observed mark. An interesting skew response can coexist with an unattractive total outcome. Carry, the underlying path, hedge turnover and the spread all matter.
A fitted response should therefore face a conventional hedge on identical observations. Parameters used to describe the history must be distinguished from parameters estimated using only earlier data and applied later.
- Keep strike, expiry, quote time and admitted observations explicit.
- Compare index and constituent options on matched dates.
- Report missing quotes and earnings exclusions.
- Show the benchmark and the cases where the interpretation fails.
The question for a volatility desk
Does distinguishing market-associated and residual moves improve the desk's understanding of its hedge assumptions? That is narrower than claiming a new trading signal. A useful answer may identify where an assumption is unreliable, even where it does not produce a profitable standalone trade.
Altus's research examines index and constituent response on that basis. The question returns after every rebound: once the index has recovered, is protection beneath it still being repriced, or has that response recovered too? In 2025 the index recovered. The surface beneath it had not. follows that question through one year and eleven. This note sets out the measurement question; it does not establish a live hedge advantage, a reliable per-stock ranking or an executable strategy.
What follows measures that distinction on the fifty largest US names over eleven years: how the surface's response to falls has changed, how much of it reaches a strike a book holds, and what it is worth in money against the cost of entry.
The constituent skew now tilts more on falls
A desk asks whether its protection responds differently to a fall than it used to. The answer has two layers, the surface and the strike a book holds.
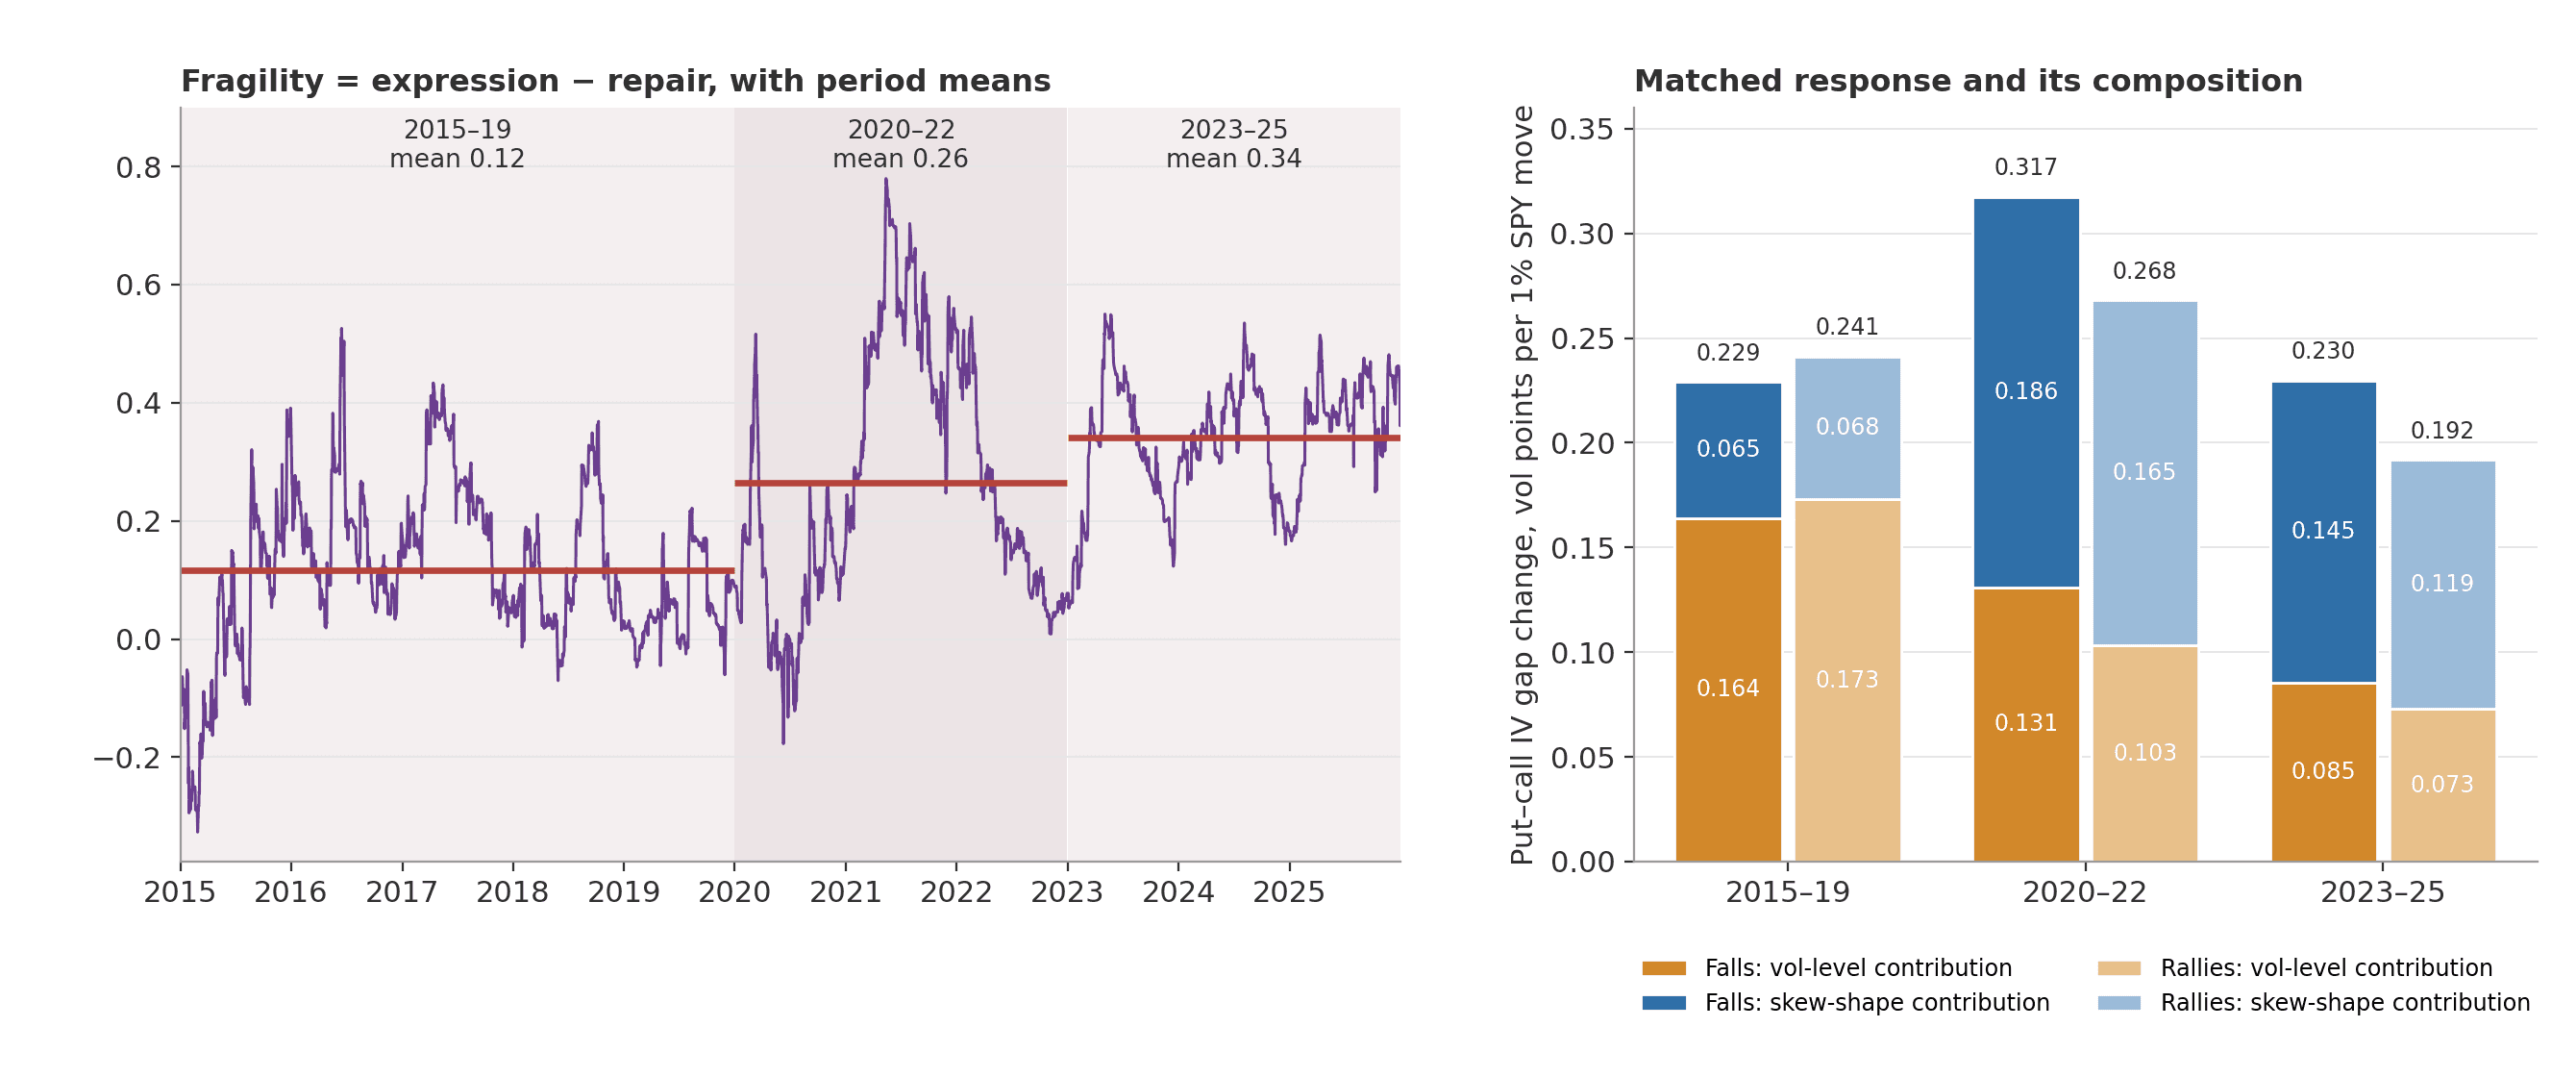
On the surface, fragility, the reading defined in Terrain and fragility, rose across periods: from 0.12 in 2015–19 to 0.26 in 2020–22 and 0.34 in 2023–25, as downside expression rose and rally repair fell. [2] Fragility is built from the log ratio of put to call volatility, so it sees only the smile's tilt: a move that lifts both wings in proportion leaves it unchanged. On its own it cannot say whether a hedge sees a bigger move.
While the put–call gap a hedge is priced on changed far less
A hedge is priced in the gap between put and call volatility, which is the mean wing level times the relative wing difference. A desk's usual skew, the risk reversal, is the gap itself, and moves with both. Its change from one session to the next splits exactly into a shape part and a level part, so the two parts add up to the change in the gap, not to fragility, which tracks the shape part alone.
On matched moves, the shape part on falls a little more than doubled between 2015–19 and 2023–25 while the level part roughly halved, so the total changed far less than either part. The tilt now does more of the work and the level less.
| Side | Period | Vol-level change | × Tilt level | ≈ Level part | Vol level | × Tilt change | ≈ Shape part |
|---|---|---|---|---|---|---|---|
| Falls | 2015–19 | 0.949 | 0.17 | 0.164 | 24.3 | 0.29 | 0.065 |
| Falls | 2020–22 | 0.900 | 0.13 | 0.131 | 27.4 | 0.65 | 0.186 |
| Falls | 2023–25 | 0.775 | 0.11 | 0.085 | 27.1 | 0.49 | 0.145 |
| Rallies | 2015–19 | 0.995 | 0.17 | 0.173 | 24.2 | 0.33 | 0.068 |
| Rallies | 2020–22 | 0.687 | 0.13 | 0.103 | 27.3 | 0.60 | 0.165 |
| Rallies | 2023–25 | 0.673 | 0.10 | 0.073 | 26.7 | 0.40 | 0.119 |
Table 1. The two parts of the gap response and their factors, per 1% SPY move on the matched days. The vol-level change and the two parts are in vol points; the tilt level and the vol level are plain averages on the same days; the tilt change is in log-ratio points (×100), so each shape part is about the vol level times the tilt change ÷ 100. Each factor pair multiplies to about its part; the remainder is the factors moving together across days. The total gap response is the sum of the two parts: on falls 0.229, 0.317 and 0.230 vol points per 1% across the three periods; on rallies 0.241, 0.268 and 0.192. 0.5–2% moves matched on direction, size and the basket's prior 30-day IV, 884 matched days. [2]
Each part is the product of two factors. The level part is how far volatility moves times the board's tilt, and both fell: volatility moved about a fifth less per 1% fall, and the tilt sat over a third lower, 0.17 against 0.11. The shape part is the vol level times the tilt's change, and both rose: the tilt's response to each fall by about two-thirds, the vol level by about a tenth, and in the later years the large bends fell on higher-vol days. On rallies the gap now closes about a fifth less than in 2015–19: volatility falls back less, and the flatter board turns less of that retreat into gap. SPY's own wings show the same shift, the shape share of their response rising from about a tenth to nearly half. The listed-options market grew sharply from 2020, and changes in who supplies index and single-name options are a plausible, untested source of such a shift. [1]
The factors, and the index's own wings, in detail
On falls, between 2015–19 and 2023–25, the vol-level change fell 18% and the tilt level 38%; in log terms the smaller vol response accounts for under a third of the level part's decline, 45% on rallies, and the flatter board for the rest. On the shape side the tilt's change rose 68% and the vol level 12%. The vol level is the plain average of the two sessions' wing levels, and 30-day at-the-money vol rose by the same amount, so the wings did not rise relative to the money: the whole constituent surface sat higher. The products of the factor pairs differ from the measured parts because the factors move together across days: in 2015–19 large tilt changes fell on lower-vol days, in 2023–25 on higher-vol days. The matching holds the basket's prior 30-day IV within 10-point bins, and within them the constituents still sat about 3 vol points higher in 2023–25 than in 2015–19. [2]
The total is the fragile part of the decomposition. Setting aside the name-days on which the tilt measure differs from the log ratio by more than 2%, 1% or 0.5% (53, 209 and 3,079 of 42,042), with the matched days and weights unchanged, the fall-side total rose by 11%, 15% and 17% between 2015–19 and 2023–25, while the shape part still more than doubled and the level part still fell by more than two-fifths. [2]
SPY's own constant-maturity 25-delta wings, built with the constituent rule and read on the identical matched days, show the same shift. The shape share of the gap response rose from 11% to 46% on falls and from 9% to 47% on rallies, about thirty-five points of share on each side, the same magnitude as the constituents' 28% to 63% and 28% to 62%. At matched starting vol the index wing's level response to a fall barely moved, 1.11 and 1.08 vol points per 1% in the first and last periods; on rallies it fell, 1.19 to 0.82. A conditional regression run on SPY with the same controls gives a fall-slope contrast of +2.14 log-skew points per 1%, against +1.00 on the constituents, and it is less sensitive to the controls: dropping the prior-skew control moves it to +2.08 where the constituents' falls to +0.57. On rallies the results split: SPY's conditional rally contrast reversed sign against an earlier build, from −0.70 to +0.52, while the constituents' conditional fit shows less rally flattening in 2023–25 (−0.68). Rally repair is therefore unresolved as a whole. [2]
At a held strike, most of the surface move is slide
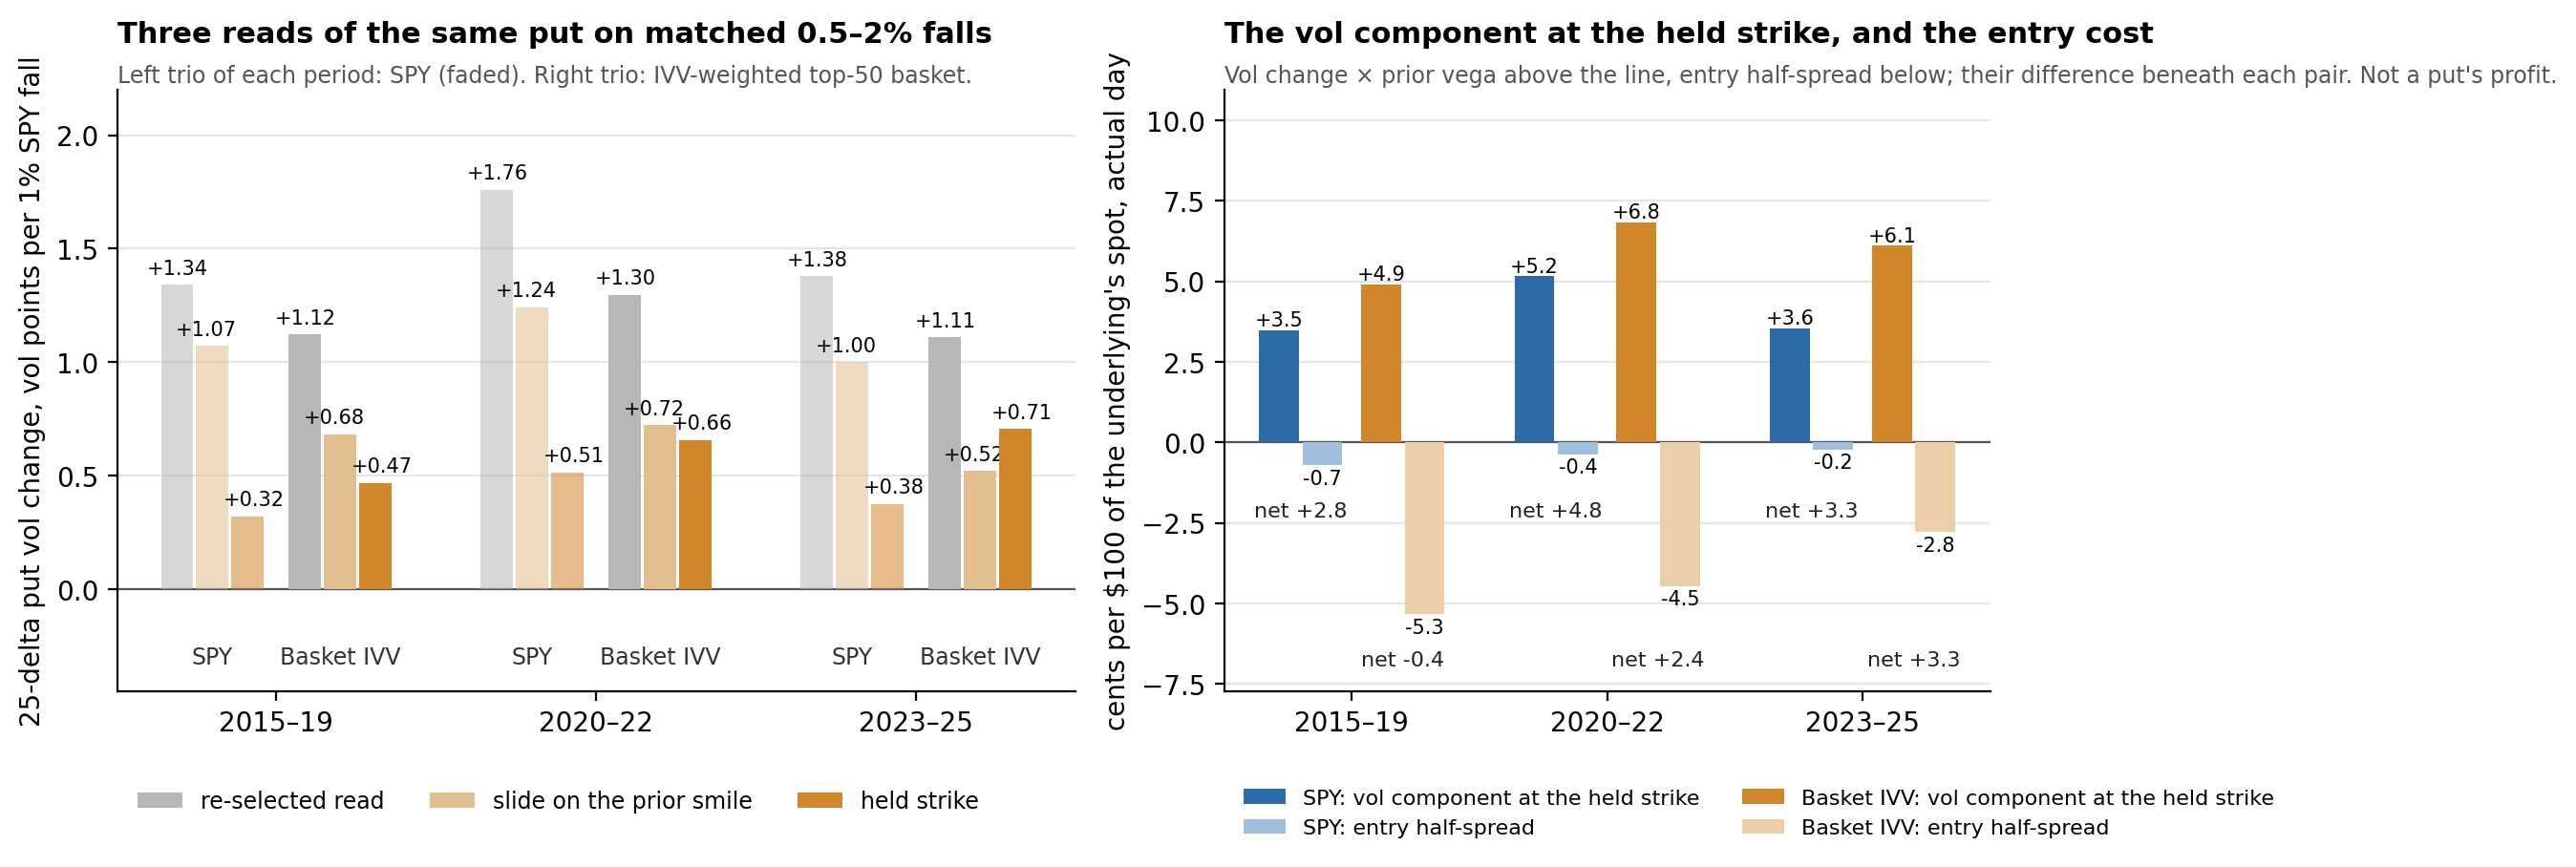
A surface reading re-finds the 25-delta strike after the fall; a book holds the strike it chose the session before. Most of the surface reading is the slide down the starting smile: about three-quarters on the index, so only about a quarter reaches the held strike, and about half on the constituent basket, where the held share rose from about two-fifths to nearly two-thirds.
| Book | Period | Days | Re-selected read | Slide | Held strike | Held share | Vol component, cents | Entry half-spread, cents | Net of half-spread |
|---|---|---|---|---|---|---|---|---|---|
| SPY | 2015–19 | 112 | 1.34 | 1.07 | 0.32 | 24% | 3.5 | 0.7 | +2.8 |
| SPY | 2020–22 | 72 | 1.76 | 1.24 | 0.51 | 29% | 5.2 | 0.4 | +4.8 |
| SPY | 2023–25 | 120 | 1.38 | 1.00 | 0.38 | 27% | 3.6 | 0.2 | +3.3 |
| Basket | 2015–19 | 116 | 1.12 | 0.68 | 0.47 | 42% | 4.9 | 5.3 | −0.4 |
| Basket | 2020–22 | 75 | 1.30 | 0.72 | 0.66 | 51% | 6.8 | 4.5 | +2.4 |
| Basket | 2023–25 | 120 | 1.11 | 0.52 | 0.71 | 64% | 6.1 | 2.8 | +3.3 |
Table 2. The 30-day 25-delta put strike chosen on the prior session, on SPY and on the quoted index-weighted top-50 basket, matched 0.5–2% SPY falls, 2015–25. On SPY, 307 of the 313 falls price every structure of Table 3, and 304 of those also have the slide and the entry half-spread. Reads in vol points per 1% fall; money in cents per $100 of spot on the actual day: the vol component of the held strike's mark (vol change × prior vega), the entry half-spread and their difference. Not a put's profit. [2]
At the index's held strike the shift is mostly a change in the starting smile: the slide fell as the starting smile flattened, while the held strike barely moved. At the basket's it is not: its held strike rose.
How the three reads are taken, and how firm they are
The surface statement above is about a surface; a desk holds a strike. We take the 30-day 25-delta put strike a desk would have chosen on the prior session, on SPY and on the quoted part of the index-weighted top-50 basket, over the matched falls, and read the same strike three ways. The re-selected read re-finds the 25-delta strike after the fall and compares its vol with the prior session's 25-delta vol: the surface convention, and what Table 1 reports. The slide is what that read would record on the prior session's smile if no strike's vol had moved at all, because the re-found strike sits lower on a downward-sloping smile; it can be computed before the open for any assumed move. The held-strike read is the change in vol at the listed strike chosen the prior session, taken on the constant-maturity smile, which is interpolated between two listed expiries on about seven in ten SPY days and read on the nearest expiry's own smile on most name-days. It is the one of the three read at a strike a book could hold, and it is a volatility reading, not a contract's profit. The three are related by an identity whose remainder is printed in our methods notes, not folded in: about 0.05 vol points per 1% of the period mean on the index and within 0.12 on the basket, and larger day by day. [2]
This is a volatility-component comparison on ordinary falls: not a held contract's profit, not a hold and not a large day. On the 35 falls over 3% in this history the index's held strike carries a little over a third of the re-selected read on the median day, eight of the 35 days above half, against a quarter to a third on ordinary falls; this history cannot say what a 7% day does. One quote snapshot, no fills. The held-strike vol is read on the constant-maturity smile, from two listed expiries on 215 of 304 SPY days and from the nearest expiry's own smile on about four in five name-days, so the strike is held and the expiry is synthetic; a rebuild on one listed contract from entry to exit, with the spot part and the exit cost, is the test a desk would run. The day counts overstate precision: the effective number of independent days per period is about 80 to 125 for the index's held-strike and net series, 60 to 135 for the basket's, and 10 to 35 for the index's slide. [2]
Held protection marks mostly on spot; entry got cheaper
In money, the vol part of a held 30-day put's mark on the day of an ordinary fall is a few cents per $100, small beside the spot move. On the index it exceeded the entry half-spread in every period: 3.5, 5.2 and 3.6 cents against 0.7, 0.4 and 0.2. On the basket, wide single-name spreads took all of it in 2015–19, 4.9 cents against a 5.3-cent half-spread, and by 2023–25 it netted as much as the index, 6.1 against 2.8.
Across four structures marked on the market's own quotes, the mark is mostly the spot move and a day's decay, the vega-neutral skew position excepted, and no change in the IV-driven part is common to them. What changed is the cost of entry, which fell to under a third of its 2015–19 level for the two-leg structures.
| Structure | Total, 2015–19 → 2023–25 | Spot and one day's decay | IV-driven part | Half-spread at entry |
|---|---|---|---|---|
| Outright 10% OTM put | 5.53 → 4.97 | 4.89 → 4.32 | +0.63 → +0.65 | 0.42 → 0.12 |
| Put spread 5/10 | 11.80 → 12.12 | 10.00 → 10.13 | +1.79 → +1.99 | 1.04 → 0.30 |
| Collar, 5% put | 35.00 → 32.27 | 33.87 → 31.82 | +1.14 → +0.45 | 1.28 → 0.37 |
| Vega-neutral skew position | −0.40 → −0.31 | −2.20 → −1.69 | +1.80 → +1.38 | 1.40 → 0.42 |
Table 3. Four 30-day SPY protection structures marked on the market's own quotes on the matched falls, in cents per $100 of index per 1% close-to-close SPY fall; the half-spread is the entry cost, not scaled by the move. The collar's call is the first listed strike whose premium does not exceed the put's, so it carries a small net debit. One 15:46 ET quote snapshot, no fills. [2]
On ordinary falls the choice between structures is a choice of delta and entry cost more than of surface response.
One gap is open
In gap terms rally relief weakened, through the level side that fragility cannot see. On the tilt alone the two measures disagree: fragility's repair fell, while the matched rally tilt response rose. One is a fitted response to every SPY shock, the other an average over matched moves, so they estimate different things, and reconciling them is open.
Where this leaves a desk
These are ordinary 0.5–2% falls, read on one quote snapshot without fills; this history cannot say what a 7% day does. The slide down the starting smile can be computed before the open for any assumed move, which is the part of a surface reading a desk can act on in advance. What the bid takes of the same held strike's re-mark on the fall day is measured in Index puts at the bid.
Sources
[1] OCC, The Options Clearing Corporation. "OCC Clears Record-Setting 7.52 Billion Total Contracts in 2020," 5 January 2021; and 2021 Annual Report, "A Message from the CEO and COO." The growth rates refer to exchange-listed options volume.
[2] Altus Works. Data and methods notes, October 2026, available to reviewers on request: the point-in-time fifty largest constituents of the US large-cap index, 30-day constant-maturity implied volatility built from option quotes, adjusted closes, the terrain and fragility readings as published by the Altus terminal on 9 October 2026, and, for each exhibit, the protocol, code and checks behind it.
[3] Vargas, V., Dao, T.-L. and Bouchaud, J.-P. "Skew and implied leverage effect: smile dynamics revisited." arXiv:1311.4078, November 2013. arxiv.org/abs/1311.4078. Background on smile dynamics.
Where the interpretation ends
Ordinary 0.5–2% falls, read on one 15:46 ET quote snapshot without fills. This history cannot say what a 7% day does. One gap between two measures of rally relief is open and recorded below.
Descriptive measurement of past market data. No portfolio holdings are analysed and no investment or trading recommendation is made.
Important information
This item describes measurements of past market data: developed history from one dataset over one window, January 2015 to December 2025, with option marks from one quote snapshot at mid, without fills. It does not establish predictive ability or trading profitability, and nothing here is investment advice, a recommendation to transact, or an offer or solicitation concerning any investment. Option and index data are licensed from third parties and remain subject to their terms. Altus Works develops the measurements and the Terminal described and has a commercial interest in their adoption.