Study / Volatility
Since 2023, correlation rose less on falls, and single names offset less of it
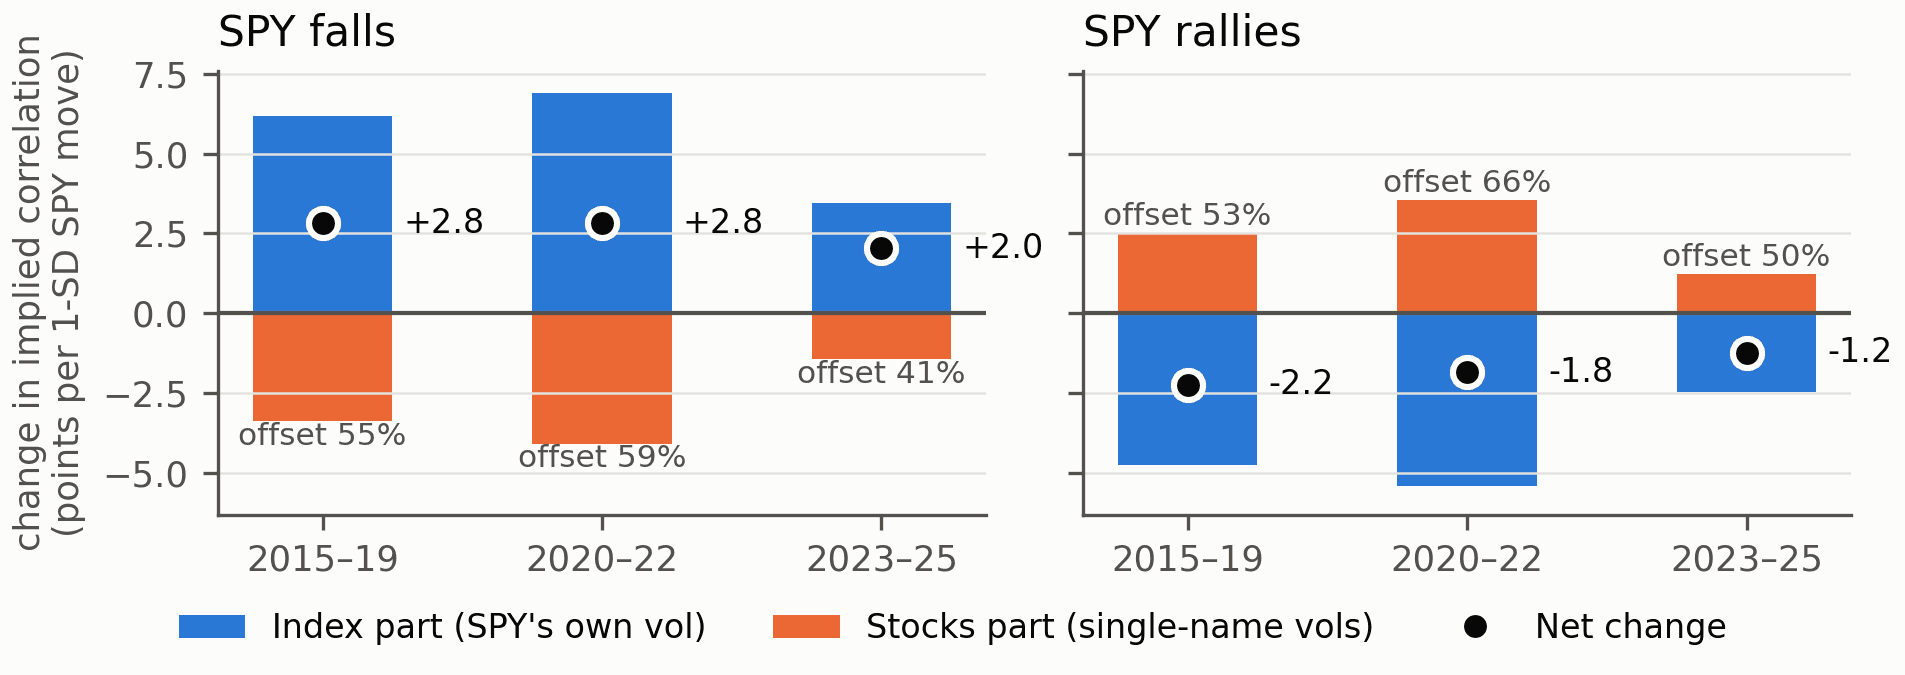
Since 2023, implied correlation built from the fifty names has risen less when SPY falls, and single names have offset less of that rise. The net change on falls is smaller, not larger, and most of the names' part moves with SPY's own implied volatility, with a remainder shared across names rather than name by name.
Reading guide
The reading is a change in top-50 implied correlation per one-standard-deviation SPY move, split exactly into an index part and a stocks part. Read the shift by era, then the shared remainder, then what the series cannot do.
What a dispersion book is long and short
A dispersion book is long single-name volatility against the index, so it cares how implied correlation moves when the index falls and how much of that move the names themselves offset. Since 2023 implied correlation has risen less on SPY falls, and single names have offset less of that rise. When a correlation price such as COR1M and a record of how the names actually co-moved diverge, as they did between February and August 2025 (the recovery study), the question is which names join common repricing, not an entry rule.
How the measure is built
Implied correlation is built the way Cboe's one-month index is, from the fifty names' 30-day implied volatilities, their index weights and SPY's own 30-day implied volatility, so that the index's variance equals the weighted sum of the names' variances plus the correlation term. A shock day is a session on which SPY's log return, divided by its 21-session realised daily volatility to the prior close, is at least one standard deviation in size; there were 848 such days between January 2015 and December 2025. The change in implied correlation on each is read in points per one-standard-deviation move, the unit the fragility readings use. Because the index's variance identity is exact, each change splits exactly into an index part, from SPY's own volatility moving, and a stocks part, from the names' volatilities moving with or against it; the two add to the net change. [1] [2]
Since 2023, implied correlation jumps less when SPY falls, and single names offset less of it
We measure daily 30-day implied correlation from the top-50 constituents and its change on SPY shock days, moves of at least one standard deviation, in points per 1-SD move, the unit the fragility readings use. Built from the names, it closely tracks Cboe's one-month implied correlation index. [1] Each change splits exactly into an index part, from SPY's own volatility, and a stocks part, from single-name volatilities moving with or against it.
The shift. On SPY falls in 2023–25 the index's push on implied correlation fell from 6–7 points to 3.5, and single names offset less of it: about 41%, against 55–59% in 2015–22. The net rise on falls is smaller, +2.0 points against +2.8, not larger. On rallies the net change narrowed too, from −2.2 and −1.8 in the earlier eras to −1.2, with the names offsetting 53%, 66% and 50% of the index part. [2]
A shared remainder. Most of the stocks part, 65–72% of its shock-day variation, moves with SPY's own implied-volatility change. The rest is shared across names rather than name by name: computed on two separate halves of the names, the remainders agree closely. It is spread close to proportionally across size, volatility-level and beta groups, and it is a different reading from the expression and repair that make up fragility (Terrain and fragility).
The checks behind the reading
| Check | Reading |
|---|---|
| Against Cboe's one-month implied correlation index: correlation of levels and of daily changes; median level gap | 0.99 and 0.87; ours 1.5 points higher |
| Share of the stocks part's shock-day variation moving with SPY's IV change, each half of the names | falls 72% and 68%; rallies 65% and 70% |
| Agreement of the remainder between the two halves of the names, Pearson (Spearman) | falls 0.80 (0.79); rallies 0.76 (0.79) |
| Largest group excess across size, volatility-level and beta groups, share of the mean absolute stocks part | 6%, high-vol names on falls |
| Correlation of the daily stocks-part series with expression (falls) and repair (rallies) | 0.53 and 0.35 |
| Reliability of the daily stocks-part series across episodes, against a pre-declared bar of 0.5 | falls 0.19; rallies 0.39, a test that cannot separate a real state from none |
Table 1. The checks behind this study, each read once under its own protocol, on 848 SPY shock days, 2015–2025. [1] [2]
What it is not
A description of periods and episodes, not a daily state. As a daily series, the stocks part failed its pre-declared test of reliability across episodes on falls, and the rally test cannot tell a real state from none. The shift is an observed difference, not separated from changes in starting levels, basket composition or at-the-money strike geometry.
The desk's own test
The test holds index and constituent weights, maturities and eligible names fixed; compares the result with return correlation, sectors, earnings and liquidity; and records vega, gamma and tail exposure in matched contracts. The readings here are descriptive 2015–2025 history; they are not a forecast or a recommendation.
Sources
[1] Cboe Global Markets. Daily index histories, 2015–2025: VIX, VIX3M, VVIX, SKEW, VIXEQ, COR1M and DSPX. VIX historical data; COR1M history.
[2] Altus Works. Data and methods notes, October 2026, available to reviewers on request: the point-in-time fifty largest constituents of the US large-cap index, 30-day constant-maturity implied volatility built from option quotes, adjusted closes, the terrain and fragility readings as published by the Altus terminal on 9 October 2026, and, for each exhibit, the protocol, code and checks behind it.
Where the interpretation ends
A description of periods and episodes, not a daily state: as a daily series, the stocks part failed its pre-declared test of reliability across episodes on falls, and the rally test cannot tell a real state from none. The shift is an observed difference, not separated from changes in starting levels, basket composition or at-the-money strike geometry.
Descriptive measurement of past market data. No portfolio holdings are analysed and no investment or trading recommendation is made.
Important information
This item describes measurements of past market data: developed history from one dataset over one window, January 2015 to December 2025, with option marks from one quote snapshot at mid, without fills. It does not establish predictive ability or trading profitability, and nothing here is investment advice, a recommendation to transact, or an offer or solicitation concerning any investment. Option and index data are licensed from third parties and remain subject to their terms. Altus Works develops the measurements and the Terminal described and has a commercial interest in their adoption.